CHALLENGE 01
Fragmented inputs
Billable and productive hours, attendance and PTO, quality, coaching, CSAT, innovation and other measures arrive from different sources.
PRISMIA is a performance intelligence concept designed to turn fragmented operational data into clear, explainable, decision-ready insight.
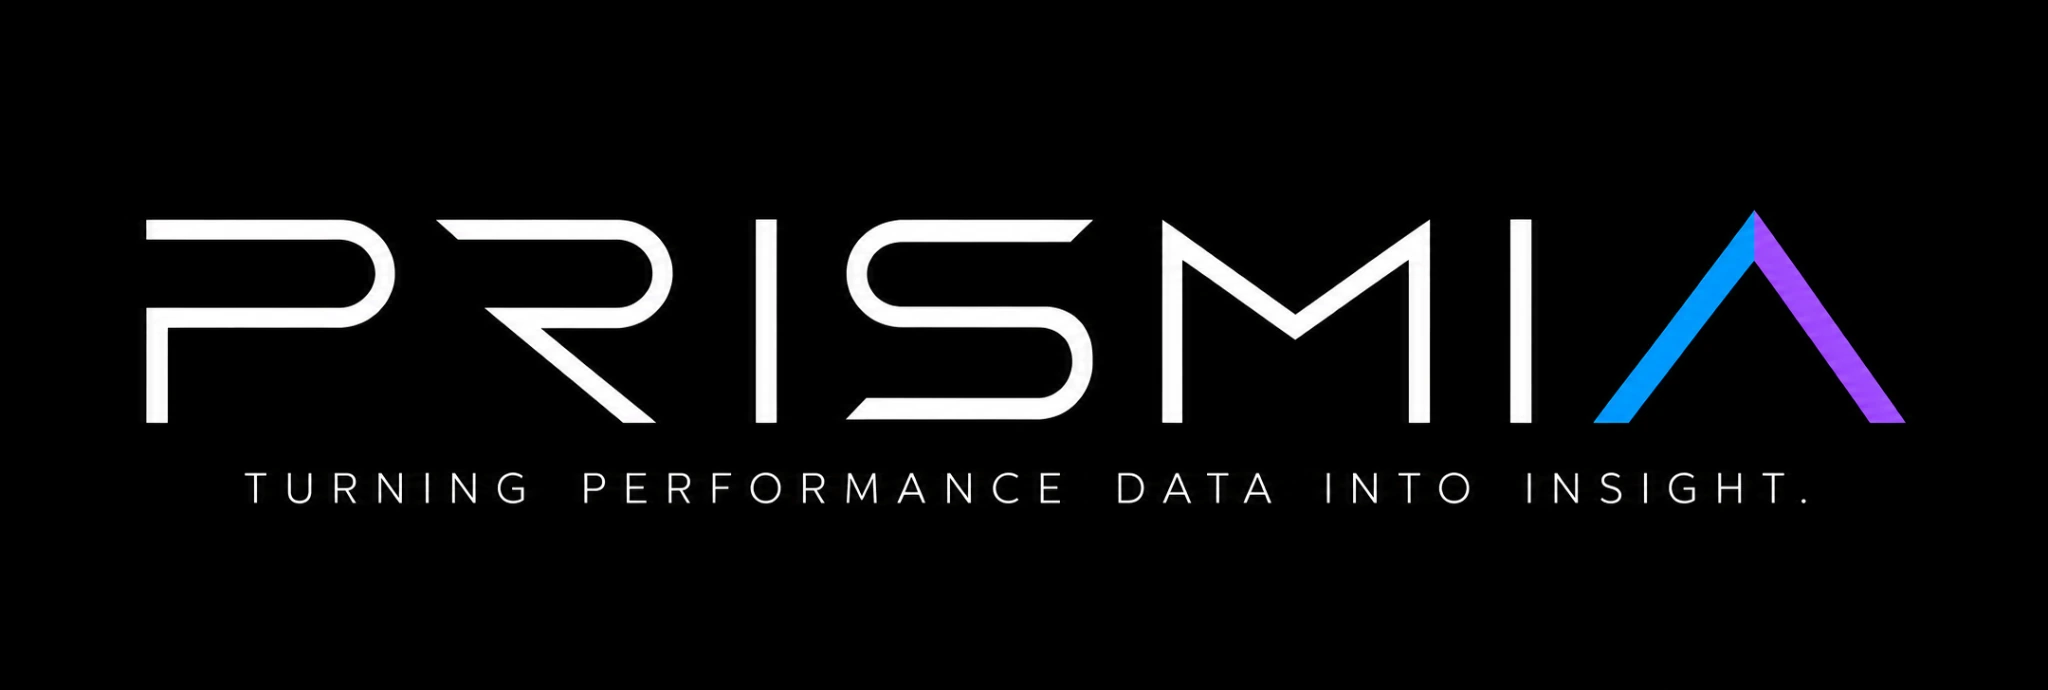
The starting point was a complex performance-management workflow spread across workbooks, pivots, formulas and source files. The identity needed to communicate synthesis—not another spreadsheet—and make analytical complexity feel understandable.
Billable and productive hours, attendance and PTO, quality, coaching, CSAT, innovation and other measures arrive from different sources.
Teams need to understand not only a result, but the inputs, rules and steps that produced it.
Productivity, utilization and ranking can vary by organization. The identity should represent adaptable intelligence, not one fixed formula.
A prism receives complex light and reveals its constituent colours. PRISMIA uses the same idea to represent multiple data streams being interpreted into a clearer picture of performance.
The triangular prism creates a strong, compact silhouette. Its internal facets suggest that one overall result can contain several distinct dimensions of evidence.
The uppercase geometric lettering gives the name a deliberate, engineered feel. Open spacing supports legibility and balances the more expressive symbol.
Cyan and blue communicate data and trust; violet adds analytical depth; magenta and gold provide contrast and signal transformation from raw inputs to useful insight.
Subtle bar-chart, segmented-chart and database cues sit within the prism. They reference measurement and structured data while allowing the prism to remain dominant.
The supplied identity-development board documents the design journey: first defining the problem, then exploring sketches and letterforms, testing symbols and colour, checking composition and context, and refining the final logo.
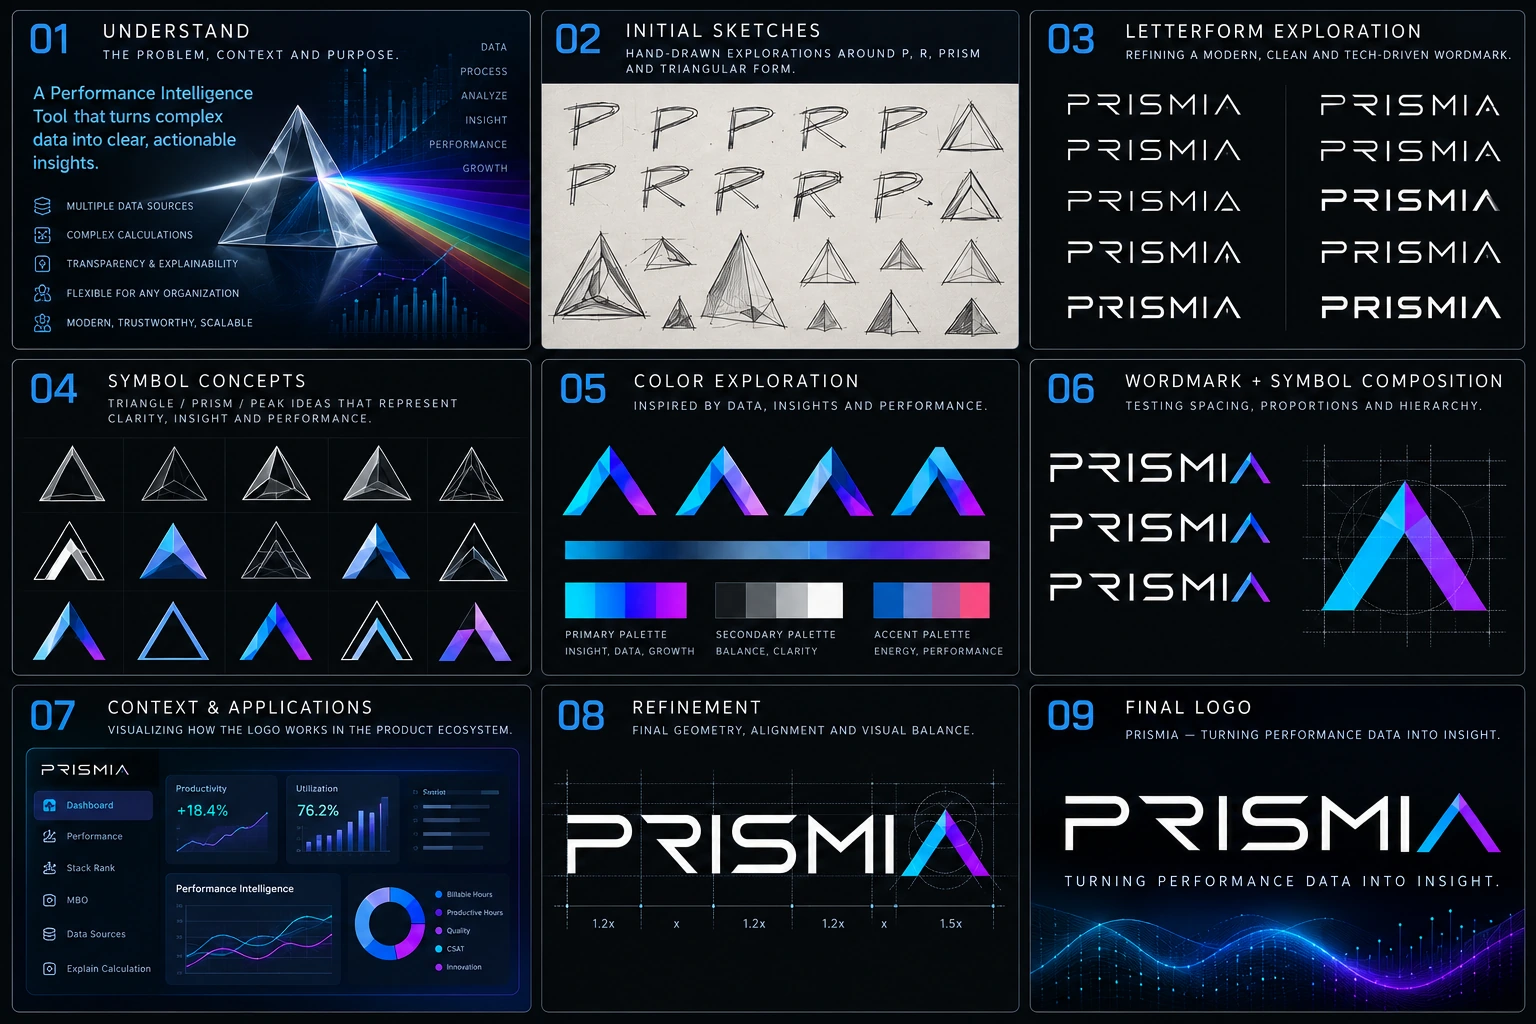
Client-supplied creation-process board. The stages below describe the sequence shown in the board; exploratory sketches are presented as design exploration, not as a claim that every pictured sketch was a separately archived deliverable.
Define the product’s purpose: convert complex performance data into clear, actionable insight.
Explore P/R letterforms, prism structures and triangular silhouettes to find a distinctive visual direction.
Test clean, modern, technology-led uppercase wordmark directions.
Compare outline, faceted, layered and dimensional prism marks for clarity and memorability.
Evaluate blue, cyan, violet and warm accent colours to balance trust, energy and insight.
Test symbol-to-wordmark scale, spacing, alignment and visual hierarchy.
Preview the identity in a performance-intelligence dashboard and its navigation environment.
Fine-tune geometry, spacing and balance to improve cohesion across the full lockup.
Bring the prism symbol, uppercase wordmark and tagline together as one unified identity.
The visual language combines a precise geometric base with a controlled spectrum. The colour is expressive; the structure remains disciplined.
Use the prism above the uppercase PRISMIA wordmark, with the tagline as a supporting line. Keep generous clear space around the symbol.
For small UI placements, use a simplified prism symbol where internal facets and embedded data cues remain legible. Avoid relying on glow effects at tiny sizes.
PRISMIA is conceived as an intelligence layer between raw operational files and the decisions people need to make. Its visual identity supports that role without suggesting that the logo itself replaces rigorous calculation or validation.
The intended experience brings upload, detection, mapping, validation, aggregation, reconciliation, calculation and publishing into a traceable workflow.
Dashboards, Stack Rank, MBO and “Explain Calculation” views are the experience layer; uploaded files remain the source of truth.
The resulting identity gives PRISMIA a visual shorthand for turning diverse evidence into a coherent performance picture. The prism is the central metaphor; the restrained chart cues connect it directly to analytics.
Scope note: This is a logo and product-concept case study based on the supplied brand mark, supplied creation-process board and project briefing. It does not claim measured business outcomes, user research results or production deployment.